
SKYDOG ATI LLC
Professional Drone Thermal Imaging & SAR Services in New England.
Mapping
-
Orthoimagery
-
Photogrammetry
-
Radiometric Thermal Mosaic
-
Infrared
-
Multispectral
-
Oblique Imagery
-
3D Models
-
Topographic
-
Planimetric
-
Corridor
Mapping can include many aspects, depending on needs. Typically involving land, where measurements (volumetric, linear, area), contours/elevation or vegetation health is wanted. Status of construction sites (progress, logistics), golf courses (turf health, water control...), volumetric measurements of stockpiles (even using IR to monitor temperatures to prevent fire) etc. Even mansions have been mapped to create models, so that the general contractor can evaluate work needed and architects can design additions etc. Police and Fire departments use mapping for crime scenes, fire sites, hurricane damage assessment, flood damage etc. Town planners use mapping to ultimately determine municipality needs etc.
Depending on the requirements, RTK (Real-Time Kenematics) is employed, where real-time GPS error correction is used. This greatly omproves the accuracy for measurements, usually a final accuracy of 1 - 2 cm range. Explained Further
Best viewed on a 4K monitor, anything less and imagery will get grainy (data loss). Deliverables can include: DEM, DTM, DSM, GeoTiff...
We also provide map post processing.
You Fly, We Process:
Professional Map Generation
Have the drone but not the data processing power? Sky Dog ATI turns your raw aerial imagery into high-resolution, actionable maps.
-
Data to Deliverables: Send us your site captures; we’ll build the 2D orthomosaics or 3D models.
-
Expert Guidance: New to mapping? We provide flight parameter consultation.
-
Fast Turnaround: Get professional-grade mapping without the expensive software overhead.
Tier
-
Basic
-
Pro
-
Specialty
Service
-
Standard Ortho
-
Elevated-Grade
-
Thermal/Multispectral
Deliverables
-
2D Orthomosaic (GeoTIFF) + Digital Surface Model (DSM).
-
3D Point Clouds & Contour Maps.
-
Thermal maps or Vegitation Index maps for agriculture.
Industry Examples
Golf Courses
Golf Courses Services
Mapping golf courses for measurements and turf health. There are many benefits, including:
-
Accurate distances between holes, legs, green depths, 150, 200 yd markers to greens etc.
-
Contours of fairways, greens for evaluating putting and water egress etc.
-
Volumetric measurements of mound / depressions for water egress management.
-
Turf health: By using multispectral drones with vegetation index mapping, detect stress in plants (due to drought, nutrient deficiency, pests, or disease) often before visible symptoms appear to the human eye.
Example is a 60 acre, 9 hole course, consisting of 900+ images (4K) taken at 200' with a RTK corrected DJI M3E.
Flight time: 16 minutes @ 34mph. Overall accuracy using coordinate system NAD83 EPSG: 3437
Accuracy : 0.7 inch


This example is a DEM (Digital Elevation Model) with contours set to 2', with water egress direction, T Boxes and greens identified and with fairway distances. These contours can also be overlayed on the normal image (orthomosaic).

Contours can be set to 1" and up.

Slope of the green.


Turf Management : Vegetation Index : NDVI (Normalized Difference Vegetation Index)
NDVI's Role:
-
NDVI measures the health and density of vegetation by comparing the reflection of near-infrared light (high in healthy plants) and red light (absorbed by healthy plants).
-
It helps detect plant stress (from drought, pests, disease, nutrient deficiency, compaction, etc.) before it's easily visible to the human eye.
-
This allows for proactive, targeted management – applying water, fertilizer, or treatments only where needed, saving resources and improving turf consistency.
Below is an example of a GNDVI (modified NDVI) mapping of the same 60 acre course.
Compare to the RGB image, notice the shadows below. This flight was taken early, where normally the best time is a few hours either side of noon, where shadows are nominal, and the solar is best. The legend in image indicates healthy vegetaion at 1(red) with possible issues approaching 0.5.
Reference: Turf Health Support Turf Management

Cemeteries
Mapping a cemetery allows
-
overall orthomosaic for display/reference
-
marking cemetary sections
-
marking family sections
-
marking individual plots
-
all markings include details of zones, families, individuals etc.
-
evaluation for water egress
-
evaluation of turf
-
location data
-
etc.
Example cemetery is ~2 acres, ~200 images taken at 150' with a RTK enabled DJI M3E. Flight time: under 5 minutes.

Family plot boundry marked with details.
Indivual plots, headstones can also include more details. i.e Full name, Dates, Allocation, Occupancy etc.

Contours to enable water egress evaluation.

Stockpiles
Mapping stockpiles allow measurements of:
-
volume
-
contours
-
linear
-
area
All with annotations (showing measurements)

These gravel piles can be evaluated as a DSM or DTM, using a
-
Use Linear fit for measuring most volumes on relatively flat ground.
-
Use Lowest point for bins, pits, or stockpiles up against a wall.
-
Use Triangulated for very large or long and narrow stockpiles on contoured ground.

Land Development
This example illustrates Fifty Four acres / 584 images / Flight time ~16 minutes, fully autonomous (repeatable), Hassablaad camera, mechanical shutter, mapping speed: 34 mph, ~1" GSD (~1" accuracy) at 300' altitude. Below, measurements include: road length, road area, cul de sac area, elevation / contours and overlay of site map onto orthomosaic of future neighborhood.
Allows for stakeholders to check status, plan, design and evaluate.


This same orthomosaic image consists of 4K images stitched together, so they offer excellent detail when expanded.


Automated, Repeatable Mission Definition

Monthly Comparisons:
One great feature of aerial mapping is being able to compare month to month changes. Options include changes to
plant health,
contours,
elevation measurements,
stockpile measurements,
linear measurements,
area measurements,
volumetric measurements
plot plans
Overlaid site plan of affected area.


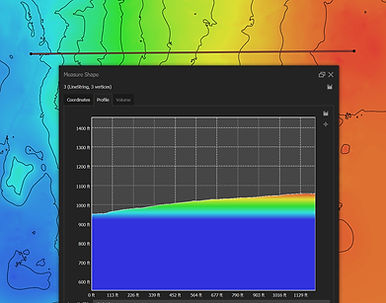
DTM (Digital Terrain Model) of same land mass, where the trees, buildings, vehicles are removed, so just the ground remains. Used for evaluating terrain. The rectangle is a proposed building site, which can be optimally positioned on the slope with the least amount of earth to move. Also would help with water mitigation. There are three ways to measure volume, to meet whatever requirement is wanted (image below). The line is just to show slope (image below).All measurements are ~1 inch accurate. RTK used (real time GPS error correction) with a mapping drone (M3E). Contours are at every 3 feet.Measurements: area, linear, volume, slope.

Trails

This 600+ acre orthomosaic comprises of
1485 4K images taken over four miles of trails.
Use Cases:
SAFETY: Reporting / Sharing location
SAR (Search And Rescue)
Reporting progress
Map making / trail identification aid
Overlay over Maps
Trail Maintenance
Trail Rerouting Planning
.
NOTE:
4K Images used for creating the orthomosaic are
available for the ultimate in terrain detail....
Bar Codes
These provide location (long/lat/alt) when scanned with a cell phone.
They can be photographed and texted to rescuers, friends, team mates...
The bar code once scanned, will open Google Maps with a pinpoint on the map. Distances can then be determined to heli pads, rescuers, friends, family etc.
A closer look....


Following are example 4K images used in this orthomosaic. They would be helpful for the best detail. Images taken at 265' altitude (at 34 mph). Lower altitudes are possible,and would increase detail. In this case, Terrain Follow was used, which allows for keeping the mapping
at a consistant elevation (important for mapping). Minimum heigth is 262 feet. Used because a 400' delta between Bog Road and McMann Road exists. Here's an example (4K image used).


RTK
Accuracy is based on anything inside the collection of imagery, called relative accuracy. Surveyor's will pin location to absolute accuracy, meaning where everything is accurate to the surface of the earth. Using RTK helps get close to absolute accuracy.
Here's Gemini AI description:"When Using an Autonomous or "Here" Position
This is common when a surveyor sets up a base station in a new area on a point with no known coordinates. The base station determines its own position autonomously from satellite observations.Absolute Accuracy: The base station's autonomous position can be off by 1 to 3 meters. This error is then systematically transferred to every point you measure.Relative Accuracy: Remains at 1 to 2 centimeters.The Difference: In this situation, the difference between relative and absolute accuracy is significant and can be several meters—equal to the initial error of the base station's position.In short, your measurements will always be very precise relative to each other, but their accuracy on a global scale is only as good as the accuracy of your base station's starting point."